Ride or Drive: A Financial Model Comparing Ridesharing to Car Ownership
Can ride-sharing really replace cars? The numbers say if you drive less than 10,000 miles, maybe.

The ride share market has experienced some changes recently, with the implementation of California AB5 and the subsequent drop of upfront pricing. Lyft and Uber are constantly balancing the dynamics of their business model with increasing regulatory scrutiny and worries of passenger safety. However, both companies continue to state that ride-sharing will one day replace car ownership entirely.
I moved to Los Angeles from Louisville, Kentucky about 6 months ago. I work out of two different offices, one in West LA and one in Downtown. I don’t drive, and have relied on public transportation, my bike, and ridesharing apps. So, my question is: are Uber and Lyft right? Can ride-sharing replace car ownership, especially in one of the most notorious driving cities in the world?
The Uber / Lyft pricing models are difficult to predict due to the large amount of inputs that are consumed in the marketplace algorithm. There are a myriad of variables that are built in, which constantly intake real-time events, such as driver location, number of ride requests, and the time of day, etc
In this paper, I first examine the cost of annual car ownership, for four different vehicle types, building in both direct and indirect costs. Then I combine my Uber and Lyft data from the past several months to examine ridesharing as a broad market, building three regression models to get a rough cost structure for ridesharing to ultimately answer the very important question:
Do we ride or do we drive?
The Cost of Annual Car Ownership
For this analysis, I’ve pulled data from 2019 AAA Driving Costs Report on 4 different types of cars: (1) the medium sedan, (2) the electric sedan, (3) the hybrid sedan, and (4) the medium SUV. Those seem to be the most practical cars for LA usage, and the ones that are most often out on the roads.
The Direct Costs

Source: AAA
The cars all have a similar annual cost, ranging from the $5,700 — $6,800 for baseline mileage. According to AAA, the average cost of owning a mid-size sedan (“ vanilla ice cream of family sedans”) was $8,643 in 2019 (assuming 15k miles driven per year). This included the cost of insurance, license and registration, taxes, depreciation, and a financing charge. The more you drive, the more expensive the vehicle is due to increased depreciation, fuel costs, etc.

I’ve also included costs of cars in California in the analysis. It’s more expensive to own a car here because cost of living is exorbitant. For example, a mid-size sedan is ~$0.3 more per mile, on average.

However, there are more costs that accompany a car than just direct costs. This is where the analysis gets a bit tricky because some of these variables can be subjective, which I will discuss. There are additional “indirect” costs that are incurred over the life of the vehicle, including tickets, parking, and opportunity costs.
The Indirect Costs
- Traffic Tickets ($146.34 + Increased Insurance Premiums)
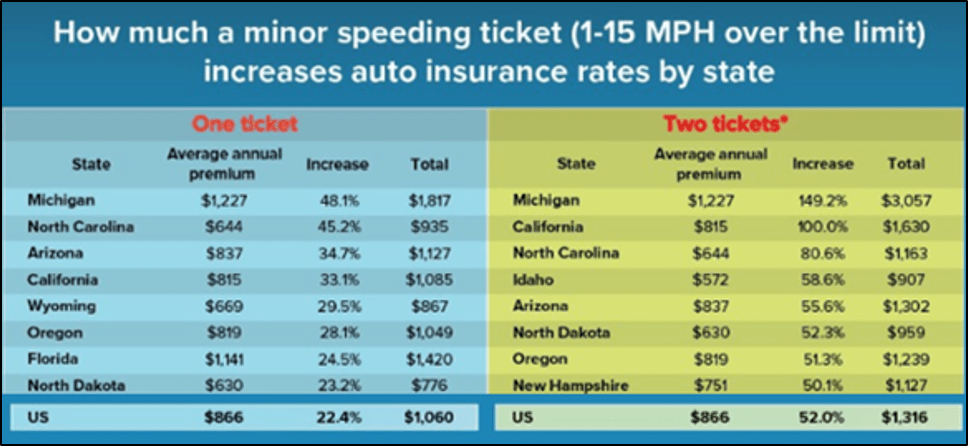
In 2018, over $6B in traffic tickets were issued to 41M people, an average traffic ticket cost of $146.34 per person. That doesn’t include the increase cost of insurance premium once you get the ticket, which can be substantial, as outlined below. One ticket in California can raise an insurance premium by 1/3 and a second ticket doubles it. If a driver gets one ticket per year, that would result in a $150 ticket charge + an $850 increase in premiums — a cool $1,000 annual increase in the cost of a car just from one ticket.
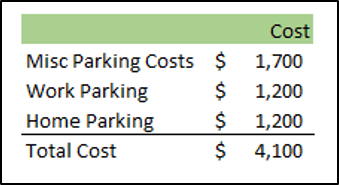
- Parking Costs ($4,100)
On average, Americans spend over $1,000 annually in parking. New York has the highest spend at $2,243, with Seattle in fifth place at $1,205. That doesn’t even account for the opportunity cost of looking for a spot — New Yorkers spent 107 hours looking in 2018. That’s 4.45 days per year, just looking for a place to park the car.
According to INRIX, parking is the largest single expense for vehicle owners. NYC was the most expensive city, as New Yorkers tend to pay for parking more often and pay more every time that they park. Los Angeles was second, with combined search and overpayments totaling $2,139.
Apartment complexes and office buildings usually charge a monthly fee, around ~$50-$150 depending on location. I am going to calculate the combined annual cost of parking and search time (with a buffer) to total ~$4,100 — totaling the total cost of search time and the total cost of parking.
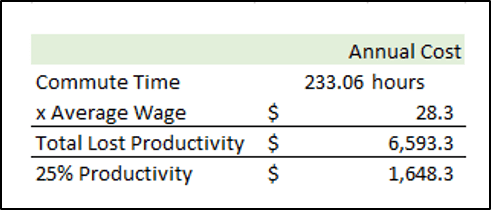
- Opportunity Cost ($1,648)
Then, there is total opportunity cost spent driving. I typed some of this article in the back of a ride share— it’s much easier to be productive when you’re not behind the wheel. The average commute time increased to 27.1 minutes in 2018, according to the U.S. Census Bureau. That’s 54.2 minutes a day, 4.51 hours a week, 19.42 hours a month, and 233.06 hours a year.
The average wage in 2019 was $28.29, according to the Bureau of Labor Statistics. Taking the average wage multiplied by the average commute time results in $6,593 in lost productivity and time at work. Even if we were only productive for 25% of that time that we spend driving rather than doing anything else, it would still be a loss of $1,648 annually.
The valuation of time is extremely subjective, and there is a lot room for modification here. Some people don’t place a dollar amount on their time, whereas others value their time more than the average wage, as shown in the calculation above. It’s all relative.
- Total Indirect Costs = $6,748
Taking whatever the cost of the vehicle is and adding the indirect annual costs results in an additional annual cost of $6,748. If you drive the vanilla ice cream of family sedans, that puts your estimated annual cost of car ownership at $15,931.
Dynamic Pricing of the Ride Share Market
It’s a hard to find the pricing structure behind ride shares. A lot of the pricing stems from the location, the time of day, and traffic. The companies also appear to modify their pricing models often and there have been multiple articles published on the frequent changes that happen in the ridesharing pricing market. With the changes of California AB5, all of this is uncertain now. According to Uber:
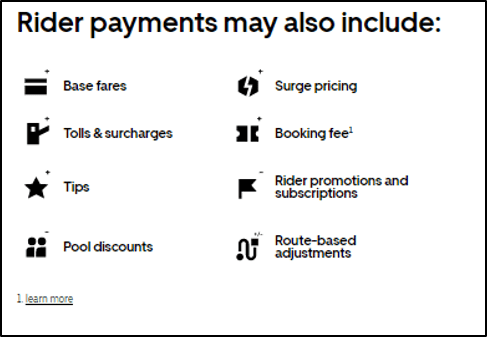
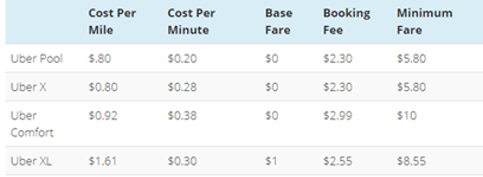
A breakdown from Ride Sharing Driver (which is probably a bit simplistic, but important for illustrative purposes) estimates the cost per mile is $0.80 and the cost per minute at $0.20–$0.28, depending on the type of Uber. The booking fee changes from city to city, but I am going to estimate a $2.30 Booking Fee.
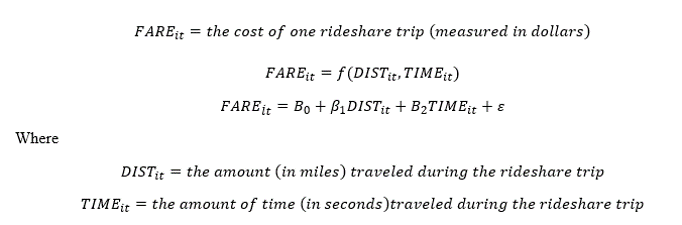
For the sake of simplicity, we can assume that the equation is:
- Assumed_Fare = Base_Fare + (Miles_Driven x Cost_per_mile) + (Minutes_driven x Cost_per_minute)
- cost_uber = 2.30 + (0.80 * miles_driven) + (0.24 * minute_driven)
The Cost of Rideshares in the U.S.
The average commute is 27.1 minutes. The average American travels over 13,476 miles per year in a car, according to the FHWA. According to AAA’s American Driving Survey of 2016, the average American takes 2.13 trips per day, for a total of 777.45 trips per year.
Assuming that the rider just used rideshares, the total cost in booking fees would be $1,788, multiplying the booking fee of $2.30 per ride, with 777 rides per year. The annual cost per mile is $0.8 * 13,476 miles or $10,781. The annual cost per minute total is $5,899, equal to the 777 trips per year, multiplied by the average commute time of 27.1, and the cost of $0.24.

This results in a total annual cost of $17,625 for riding Uber or another ride-sharing platform. I wanted to validate this beyond the basic model, so I scraped my own data.
Kyla’s Ride-Sharing Data
I moved to Los Angeles 6 months ago from Kentucky. I left my beloved Subaru Outback in the hands of my younger brother and decided that I would forge through LA carless — a sin to most Angelenos.
I work out of West LA and I live close to the office. I go to work very early in the morning, and in the beginning, I walked from my house to my office. After being chased by someone, I started biking it. However, biking in LA is a risk, without much reward.

I began to work out of a Downtown office as well, doing split-days three days a week between Downtown and West LA. I usually leave West LA around mid-afternoon to head Downtown, and head back West later in the evening. So, I have three separate commute times, if I choose to rideshare in the early morning, all with varying price pressures and dynamics. It is important to note that most of my transportation is outside of typical rush hour traffic time, so the analysis below might be skewed because of that.
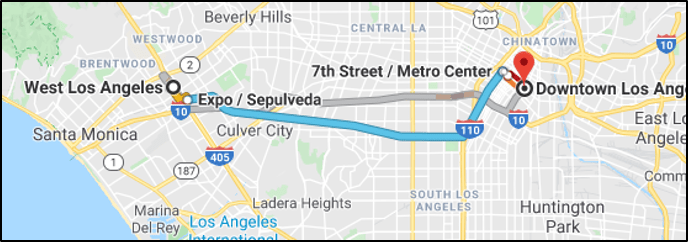
West LA to Downtown is a ~12-mile commute, and I can’t bike it. I used to bike to the Expo Line and park my bike outside, but someone deflated my tires and my head was petted more than once on the line (welcome to Los Angeles Public Transportation), so I’ve been avoiding all public systems for the past few months. I take Uber or Lyft almost every day, usually pulling up both apps to compare the cost between the two.
Because of my work schedule I avoid most price surging that occurs at during rush hour, demarcated in red on the graph below. As shown by the stacked area, I ride most often in late afternoon and the evening. The average prices I receive could be lower because I tend to avoid “surge pricing”.

The below chart details my ride-sharing habits. I take Shared more often than I take a Solo ride, primarily for safety but also to save money and the environment (an attempt at least). If I need to get somewhere quickly, I’ll use UberX or Lyft, which is Lyft’s non-shared ride. If I am indifferent, I’ll use Shared. Shared is usually $5-$7 cheaper. I usually regret taking Uber Pool because it can add up to four additional people, which can be extremely painful.

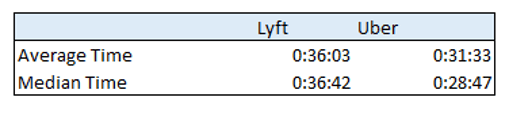
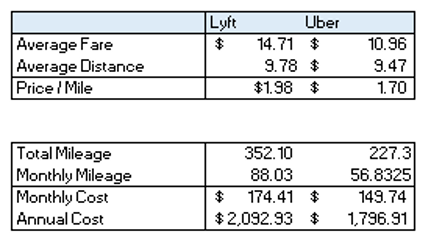
My average time traveled in Uber is about 4.5 minutes left than Lyft, and my median time is much lower. That could mean that my Uber drivers are more efficient, or perhaps Lyft is cheaper for longer rides, so I choose it more often. 61% of all my rides are from Westside to Downtown, with a larger proportion of my Ubers taking me somewhere other than Downtown. 21% of the time I use Uber to go Downtown, the other 40% of the time, I use Lyft.
I have traveled 580 miles over the past four months. That puts my estimated annual mileage at 1,738, which is extremely low (and a little sad, honestly). If I had my own car, I imagine that this would increase by at least 25%, as I would have freedom to travel on the weekends and escape Los Angeles.
Examining the Data
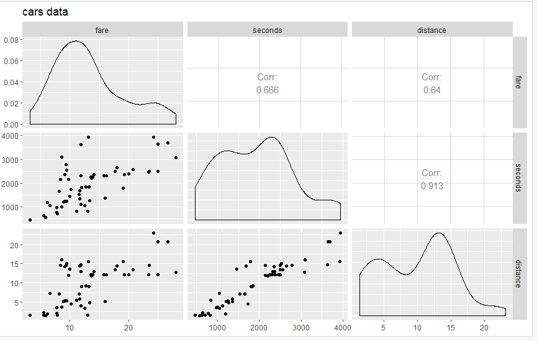
This is a correlation plot between my three main rideshare variables, fare, seconds, and distance. The goal of this analysis is to predict the fare, or the cost, of the rideshares. I will be extrapolating my data out into the thousands of miles, which means that I assume that the relationship will stay constant.
To illustrate the issue of extrapolation, consider what Robert Chira once said about Apple’s valuation:
“If you extrapolate far enough out into the future, to sustain that growth Apple would have to sell an iPhone to every man, woman, child, animal and rock on the planet.
Model 1: Using Seconds and Distance to Predict Fare
I ran a basic linear regression in R to see the predictive power of seconds and distance in determining fare, since that is what most ride-sharing models are based on, including the aforementioned Ride Sharing Driver’s model, as well as Kyle Hill’s model from 2014.
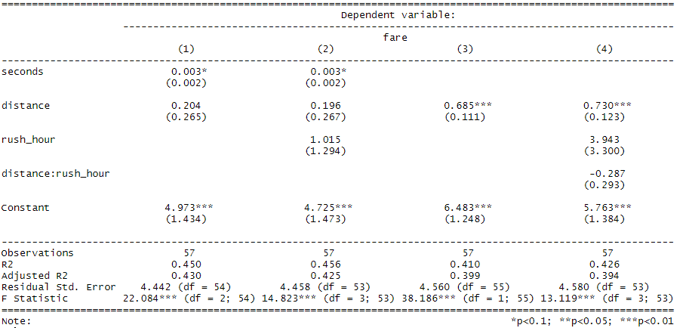
Taking the data from the regression, the model then becomes:

This implies that for every additional mile and second traveled, the fare will increase by $0.204 and $0.003, respectively. The issue with this model is that the correlation between distance and seconds is 91%, creating a multi-collinearity problem, which I will address later.
Model 2: Including a Dummy Variable for Rush Hour
I modified the equation to add in a dummy variable to determine if we are in rush hour or not. Rush hour (in Los Angeles) is between 6am — 9am and 3pm — 7pm. Any time outside of that window is non-rush hour. I had 40 rides that were outside of rush hour and 18 that were within rush hour specifications.

Taking the data from the regression, this becomes:

This implies that for every additional mile and second traveled, the fare will increase by $0.196 and $0.003, respectively. If you are driving during rush hour, your price increases by $1.015.
Model 3: Dropping Seconds, Generating Interaction Term Between Distance and Rush Hour
By adding in an interaction term between distance and rush hour, I am making the assumption that the effect of distance on fare is different for rush hour vs non-rush hour, which makes sense. You could drive 1 mile in California at 5 pm, and it could take you $30, because several users are demanding the service, whereas the same ride at 4 am would only cost $3— the time of day will impact how much you pay for the ride-share due to the law of supply and demand. The fare will be different depending on if it is rush hour or not. This is basically a proxy for surge pricing.

I dropped seconds out of this model because the correlation between the distance and seconds is 0.913, which is extremely high, as mentioned in the analysis of Model 1. The VIF between the two isn’t as high as ten, but still relatively high. Stripping seconds out of the model didn’t reduce the R-squared dramatically, as I will talk about below.

This model then becomes

Comparing the Models
(Please don’t shun me for text output).
As you can see from the output above, the R-Squared doesn’t vary too much between models despite the change in variables. Unfortunately, the R-Squared isn’t very high. The addition of more variables and more data would improve that. Model 3 is just the relationship between distance and fare.
Model N: Linear vs. Robust Linear Model vs. Quantile Regression
I wanted to keep this analysis as compact and concise as possible, but I also wanted to make sure that I address the fact that there are several other regression methods that I could have used. The linear regression is the most well-known method, and thus was the one that I used throughout this analysis. The Robust linear model simply controls for outliers, which wasn’t a big problem in my dataset.
The quantile regression model, rather than taking the average like a linear model would, estimates using the conditional median function. This also works to control for outliers. Going to in-depth on this is outside the scope of this analysis, especially because the sample size is relatively small, but I wanted to include this as a caveat. Uber actually wrote a piece about quantreg back in 2016 in order to account for the varied pricing dynamics they deal with.
Conclusion: If You Drive Less than 10,000 Miles, Ditch Your Car
I held seconds constant in the analysis for the first two models and included rush hour in the output. I included rush hour because that will give the most robust analysis for the increasingly congested cities and the average person’s commute schedule. For the U.S. analysis, I set indirect costs equal to $3,000 to tease out the cost of California living.
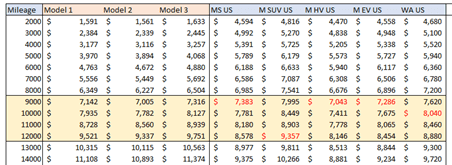
I’ve color-coded each to show the point where you would be better off driving. For most of the models, the cross-over point is between 9,000 – 12,000 miles. If you have a hybrid, electric, or mid-size sedan, you’re getting the most bang out of your buck. The ride share companies only can compete in price up to 9,000 annual miles. SUVs are the most expensive vehicle, and their crossover point is ~12,000 miles.
If you own a car in California, you’re wasting money. At most points, it’s much cheaper to use rideshare. I set indirect costs equal to $6,000 to account for the higher cost of California living.

There are a lot of reasons that the data could be telling this story, including how I priced cars and my personal ride-sharing data. However, ride-sharing is a better option for low-mileage users as compared to driving according to this analysis.
There are a lot of reasons that the data could be telling this story, including how I priced cars and my personal ride-sharing data. However, ride-sharing is a better option for low-mileage users as compared to driving according to this analysis.
There are different ways to value your time, which could impact how you value ride-sharing versus driving. But you have more freedom with a car, and don’t have to worry about other passengers, the driver, or not being in control of the vehicle. Also, this data doesn’t consider the changes that are coming with California AB5, which could radically change all of the models, which is quite sad.
Overall, the driving experience is pretty subjective. From a quantitative viewpoint, it’s sometimes cheaper to get a ride share. Qualitatively, it all depends on what you value.
**Disclaimer: none of this is investment advice, and I have no affiliation with any ride-sharing company

Leave a comment